Articles to discover
 Climate · Nov 6, 2026Arctic methane: why estimates are not yet telling the same storyThe AMPAC-Net review highlights a gap between two methods of estimating emissions. Understanding this difference means distinguishing stored carbon, released gases and measurements in the atmosphere.↗
 Climate · Nov 6, 2026Aviation and climate: why changing fuel does not solve the whole equationA study compares aviation pathways with planetary boundaries. To understand its findings, we need to look at fuel life cycles, the resources used and traffic assumptions.↗
 Climate · Nov 6, 2026In Greenland, a lake beneath the ice delays the release of meltwaterBeneath Flade Isblink, an invisible reservoir fills in summer and empties mainly in autumn. Satellites reveal why the date of melting alone is not enough to predict when water will arrive downstream.↗
 Climate · Nov 4, 2026Climate and health: what the 2026 Lancet Countdown warning revealsMortality, exposure and protection: the 2026 report shows why the health effects of climate change demand more than a response to heatwaves.↗
 Climate · Nov 4, 2026Winter: a mild trend does not mean three months without coldMétéo-France favours a mild quarter from November to January. What this probability means, and what it does not tell us about cold or snow.↗
 Nature and environment · Nov 4, 2026Threatened palms: why our gardens don’t tell their whole storyA cultivated species can remain threatened in the wild. Research in Madagascar and around the world shows how to interpret the figures and the limits of conservation.↗
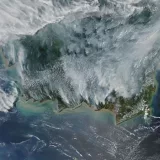 Nature and environment · Nov 1, 2026Fires in Indonesia: understanding the human toll of the smokeCREA estimates that smoke was linked to 3 560 deaths in September 2026. Behind this figure, different methods and environments shed light on the crisis.↗
 Politics · Nov 1, 2026Energy support in 2027: two timelines for households in LuxembourgThe 29 October agreement extends support for electricity and heating throughout 2027. The discount on petrol and diesel will end in late February. Amounts, conditions and disagreements: what the signed text provides for.↗
 Climate · Nov 1, 2026Retreating glaciers: what a map cannot tell a walkerMaps record the retreat of glaciers, but do not describe conditions on the day. From measuring climate change to unstable terrain and route planning, here are the key distinctions to bear in mind.↗
 Politics · Oct 28, 2026United States: corruption rivals inflation, while allegations against Kushner remain disputedAs the midterm elections approach, 60% of American voters say they are extremely concerned about government corruption. The allegations against Jared Kushner, however, are disputed and have not been independently verified.↗
 Climate · Oct 28, 2026After Lula’s re-election, how should we interpret the fall in deforestation?INPE estimates that deforestation in the Legal Amazon amounted to 3 335 km² for August 2025–July 2026. This decline predates the election and should not be confused with either restoration or a target already achieved.↗
 Climate · Oct 28, 2026The carbon footprint of the wealthiest: what the capital footprint measuresOxfam cites an estimate of 249 tonnes of CO₂e for the capital held by the wealthiest 1% in France. This figure for 2022 sheds light on who owns the activities that generate emissions.↗


